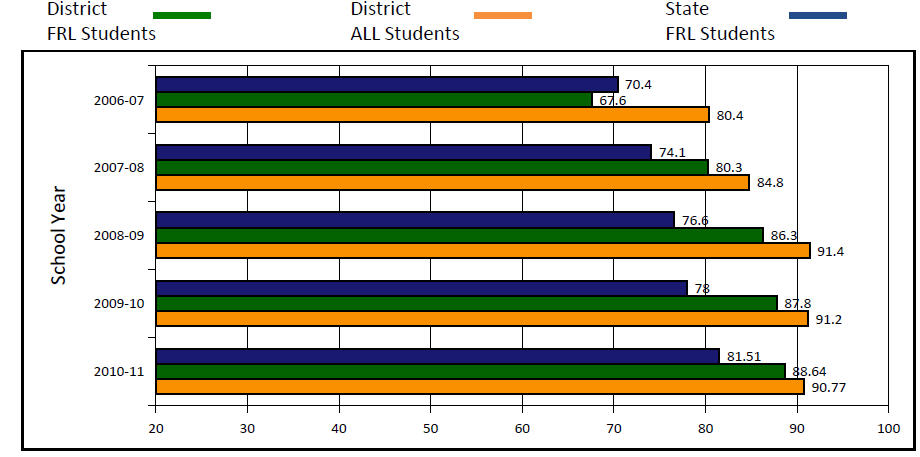
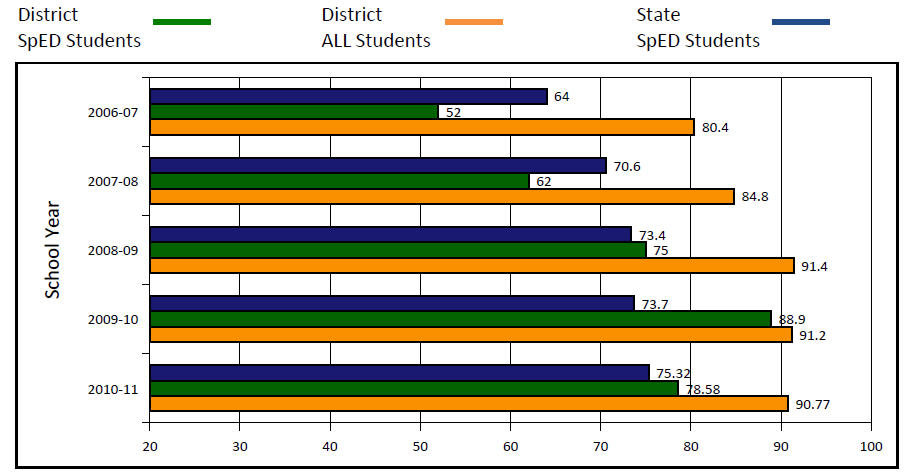
READING PERFORMANCE GOALS BY YEAR:
In order to meet the requirements of adequate yearly progress, very student group must meet or exceed annual targets in reading while maintaining a participation rate of 95% or more. The chart below details the annual performance goals for the past several years.
| SchoolYear | K‐8 Students Goal |
9‐12 Students Goal |
District Reading Goal |
District % Met Goal |
Kansas State % Met Goal |
| 2006‐07 | 69.50 |
65.0 |
65 |
80.4 |
81 |
| 2007‐08 | 75.60 |
72.0 |
72 |
84.8 |
84.3 |
| 2008‐09 | 79.90 |
76.7 |
76.7 |
91.4 |
85.8 |
| 2009‐10 | 83.70 |
81.3 |
81.3 |
91.2 |
86.3 |
| 2010‐11 | 87.80 |
86.0 |
86 |
90.77 |
87.8 |
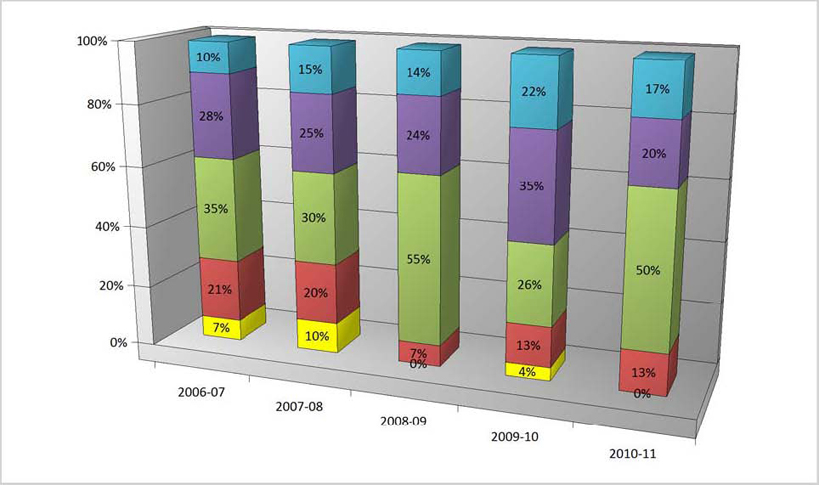
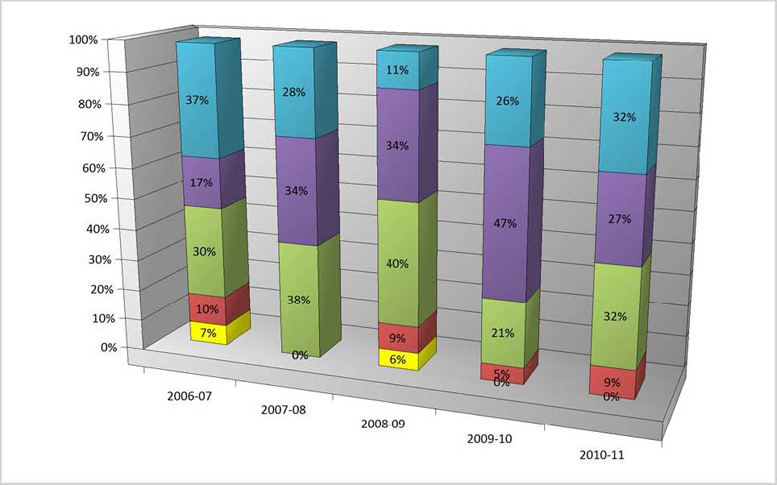
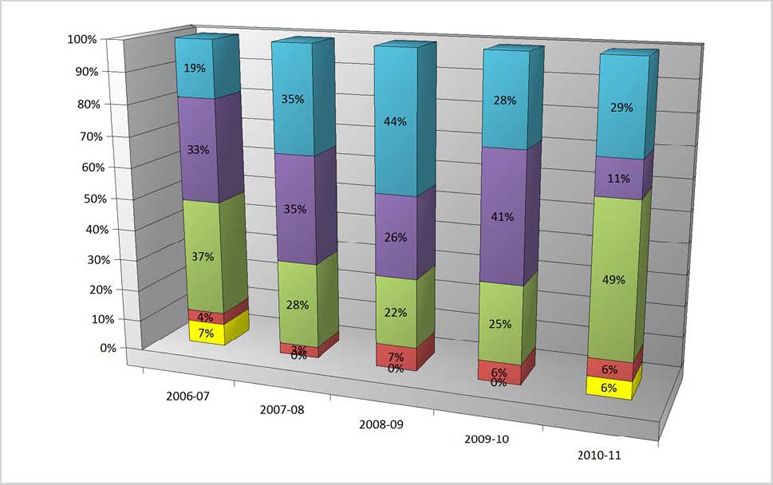
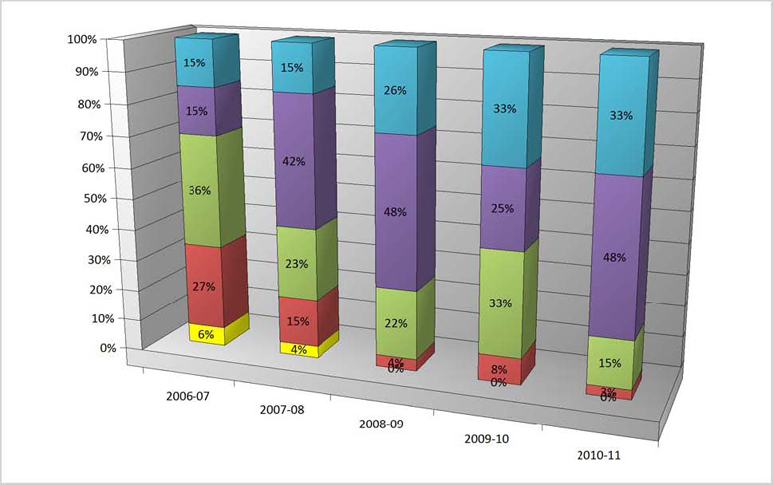
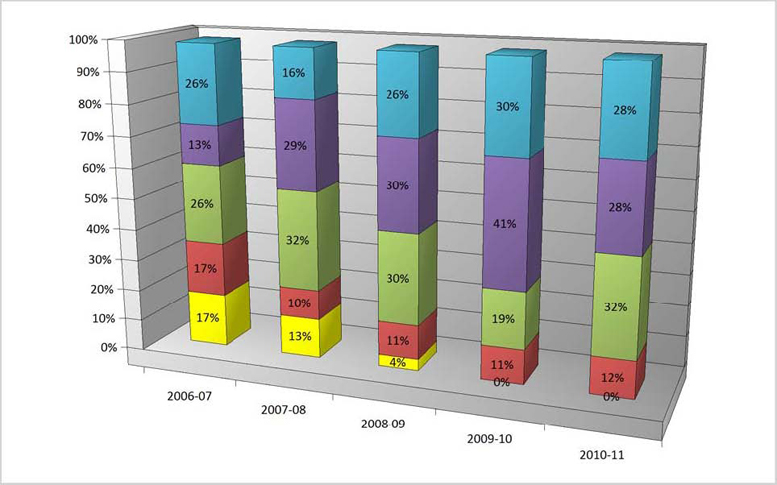
READING SCORES BY GRADE:
The following graphs show the change in percentage scoring within each of the following ranges for each of the past years indicated:

3rd Grade Reading
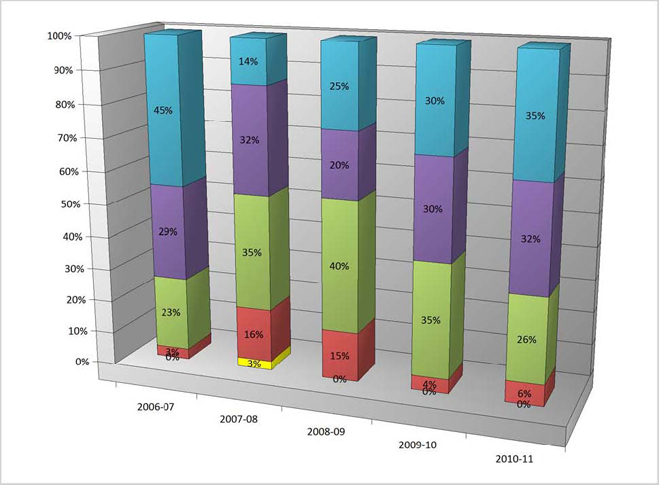
4th Grade Reading:
5th Grade Reading: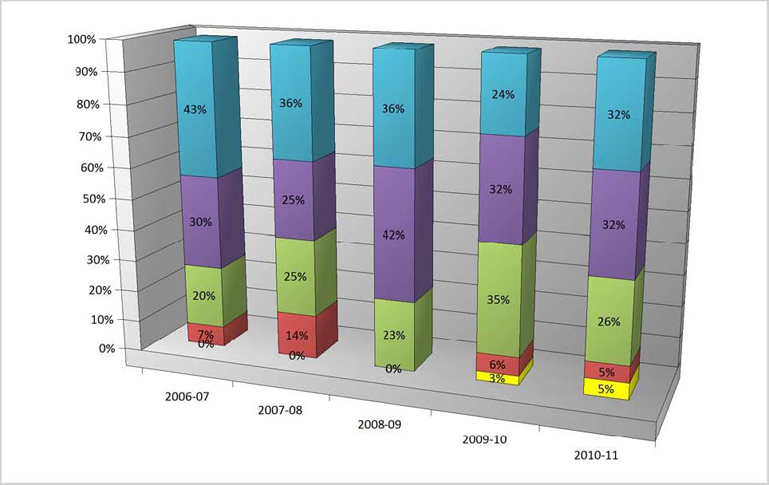
6th Grade Reading:
7th Grade Reading:
8th Grade Reading:
11th Grade Reading: