MATH PERFORMANCE GOALS BY YEAR:
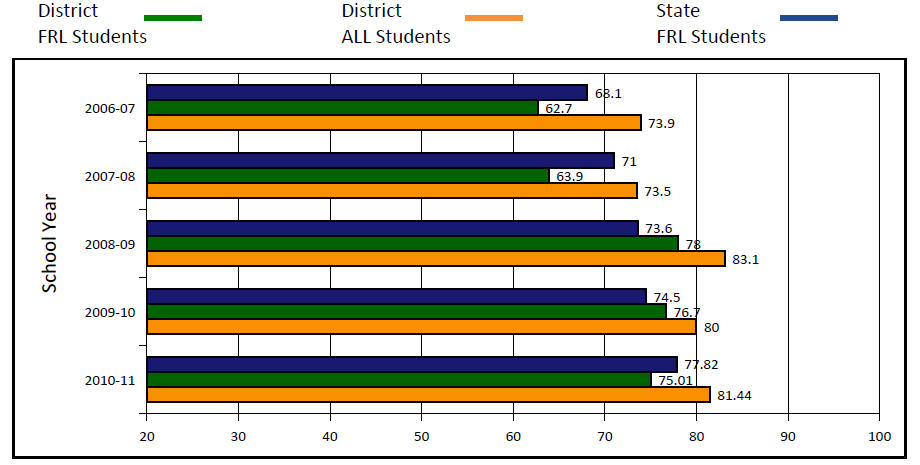
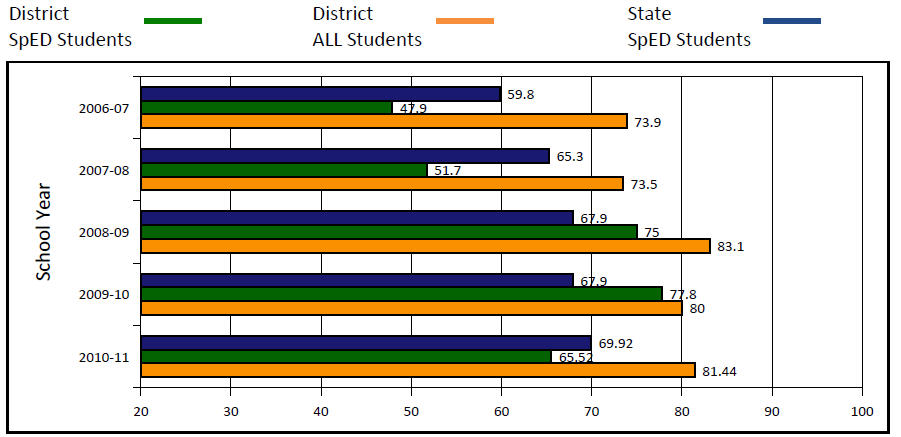
In order to meet the requirements of adequate yearly progress, very student group must meet or exceed annual targets in reading while maintaining a participation rate of 95% or more. The chart below details the annual performance goals for the past several years.
| School Year | K-8 Students | 9-12 Students | District Goal | District Met Goal | Kansas Met Goal |
|---|---|---|---|---|---|
| 2006‐07 | 66.80 |
55.7 |
55.7 |
73.9 |
78.2 |
| 2007‐08 | 73.40 |
64.6 |
64.6 |
73.5 |
81 |
| 2008‐09 | 77.80 |
70.5 |
70.5 |
83.1 |
82.8 |
| 2009‐10 | 82.30 |
76.4 |
76.4 |
80 |
83.1 |
| 2010‐11 | 86.70 |
82.3 |
82.3 |
81.44 |
85.58 |
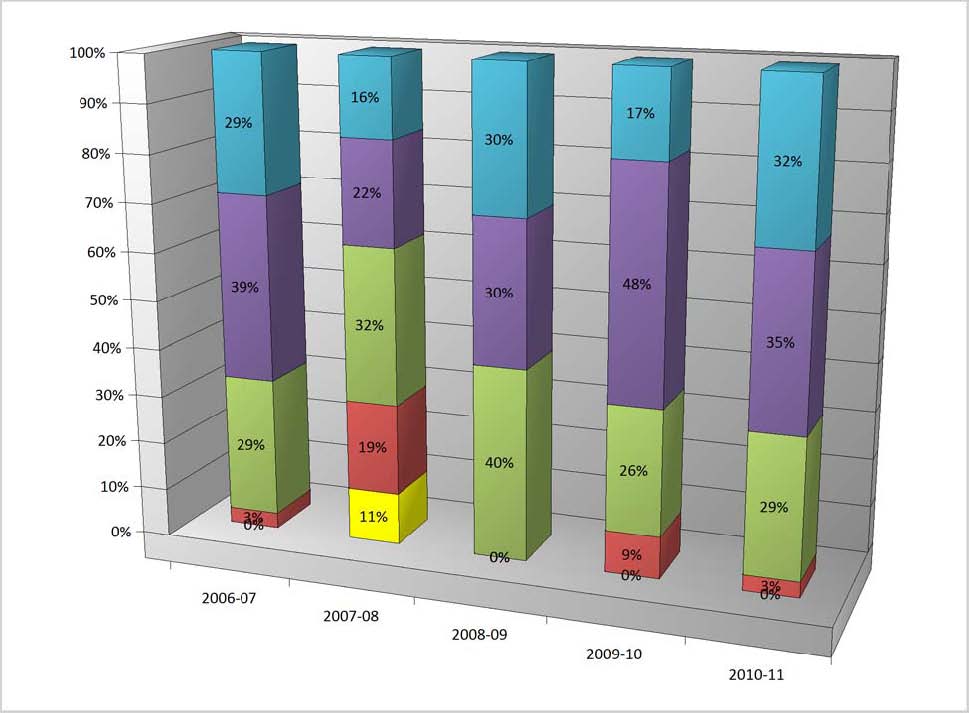
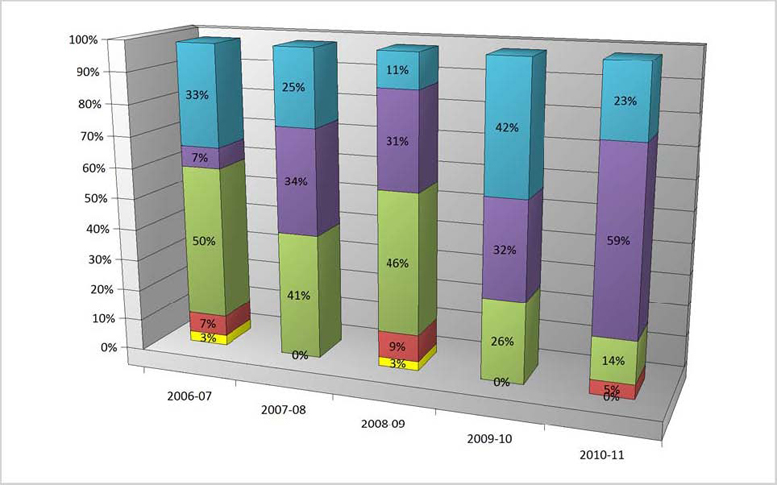
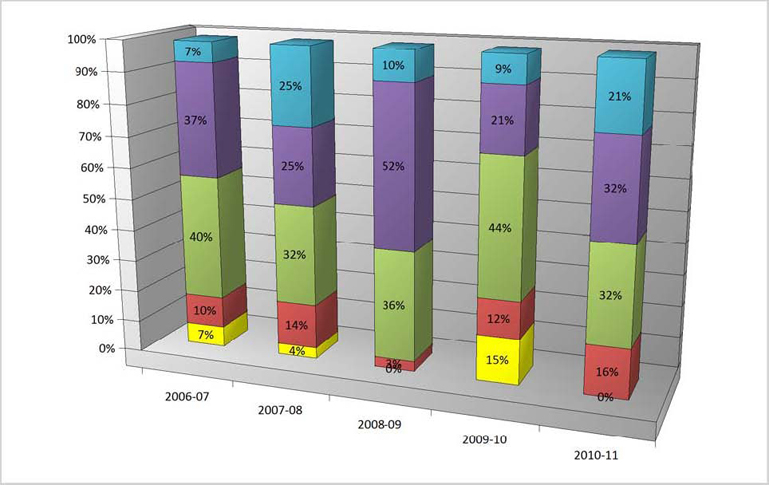
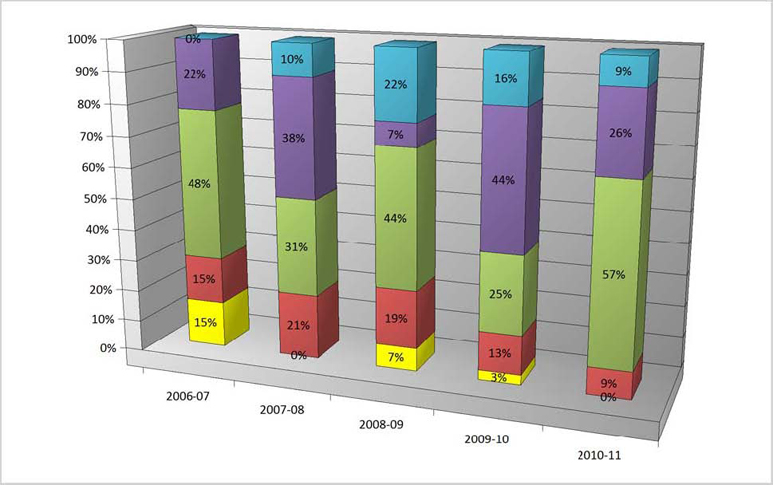
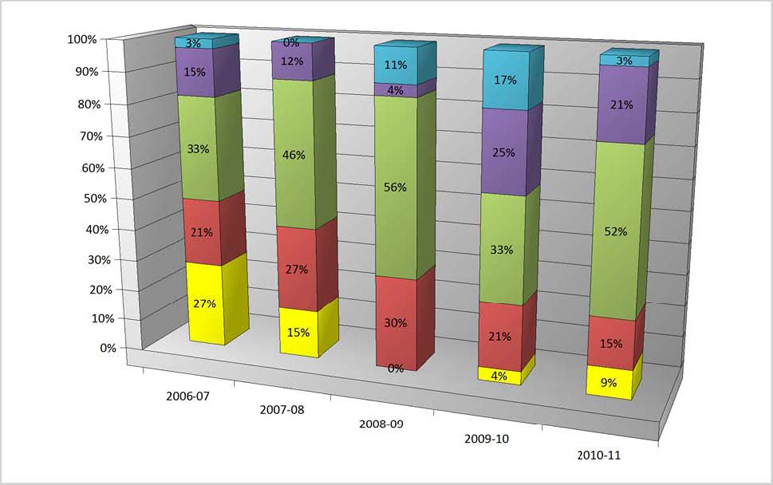
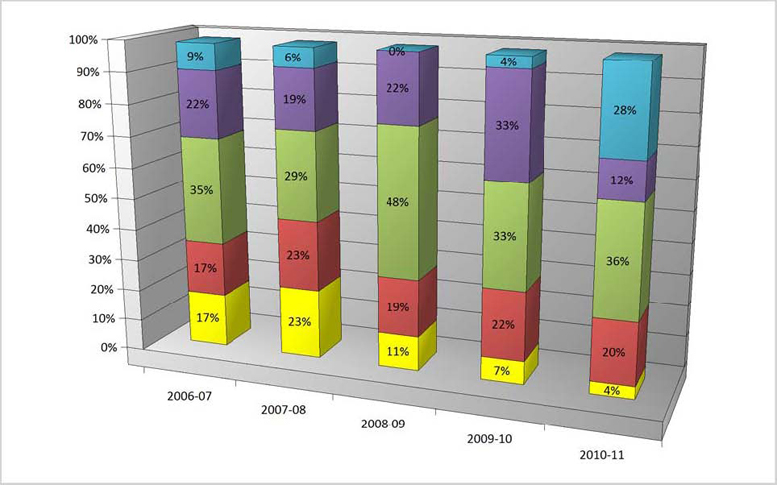
The following graphs show the change in percentage scoring within each of the following ranges for each of the past years indicated.

3rd Grade Math:
4th Grade Math:
5th Grade Math:
6th Grade Math:
7th Grade Math:
8th Grade Math:
10th Grade Math: