DISTRICTBUILDINGS: |
CITY |
BUILDING TYPE |
GRADES SERVED |
2011‐12 ENROLLMENT |
TROY ELEMENTARY |
Troy |
Elementary |
K - 6 |
186 |
TROY HIGH AND MIDDLE SCHOOL |
Troy |
High School |
7 - 12 |
178 |
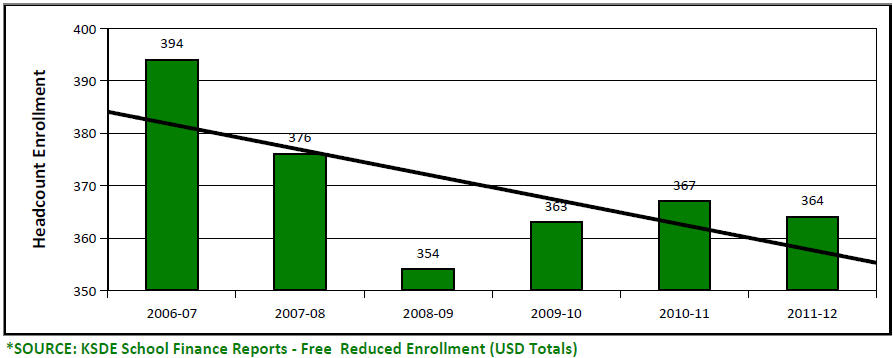
DISTRICT ENROLLMENT TREND:
ENROLLMENT HISTORY BY RACE
| School Year | Total Enrolled |
White |
Black |
Hispanic |
Am Indian / Alaskan |
Asian |
Hawaiian / Islander |
Multiple Races |
| 2007- 08 | 376 |
364 |
0 |
6 |
2 |
1 |
0 |
3 |
| 2008-09 | 354 |
344 |
0 |
4 |
1 |
1 |
0 |
4 |
| 2009-10 | 363 |
351 |
0 |
5 |
1 |
1 |
0 |
5 |
| 2010-11 | 367 |
357 |
1 |
6 |
0 |
0 |
0 |
3 |
| 2011-12 | 396 |
381 |
1 |
9 |
0 |
0 |
0 |
5 |
SOURCE: KSDE K‐12 School Reports ‐Enrollment by Grade, Race, Gender (Includes Pre‐K Non‐Graded Students)
DISTRICT HISTORY FREE REDUCED LUNCH ELIGIBILITY:
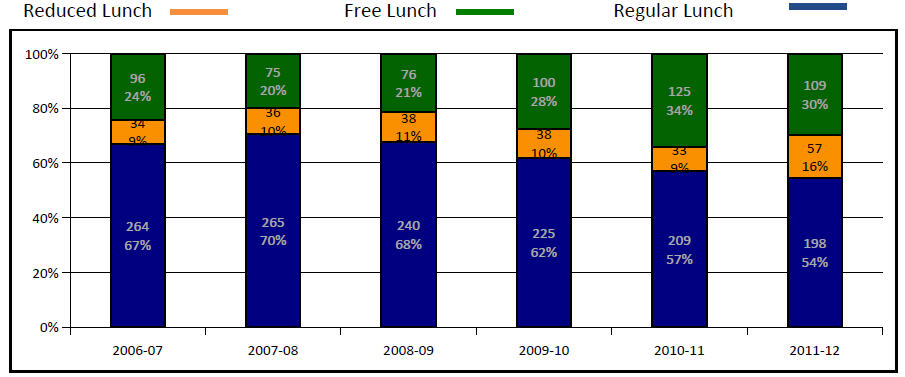
| CURRENT ELIGIBILITY BY BUILDING: |
Enrollment |
Free Lunch |
Reduced Lunch |
Percent FRL |
|---|---|---|---|---|
| TROY ELEMENTARY |
186 |
64 |
26 |
48.4% |
| TROY HIGH AND MIDDLE SCHOOL |
178 |
45 |
31 |
42.7% |
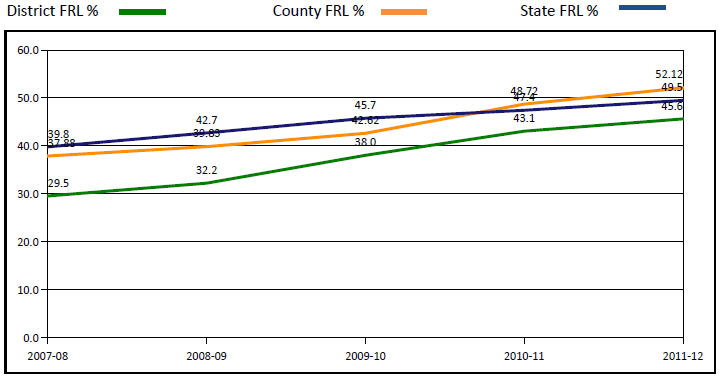
COMPARATIVE HISTORY FREE & REDUCED LUNCH ELIGIBILITY:
The following chart shows the eligibility for free and reduced lunches over time as compared to the
county and state averages for the same school years.
District Personnel
No Child Left Behind (NCLB), Title II, Part A ensures that all K‐12 students have teachers with subject matter knowledge and teaching skills necessary to help all students achieve high academic standards regardless of their individual learning styles or needs. All general education core content teachers must be “highly qualified."
Below is the status of USD 429 teachers for the 2010‐11 school year. Data provided by special request from the KSDE Research & Evaluation help desk.
| School | Subject | % Highly Qualified |
|---|---|---|
| TROY ELEMENTARY | Fine Arts | 100.0
|
| English Language Arts | 100.0 |
|
| Elementary | 92.3 |
|
| TROY HIGH AND MIDDLE SCHOOL | Science | 100.0 |
| Mathematics | 33.3 |
|
| History & Government | 100.0 |
|
| Fine Arts | English Language Arts100.0 |
|
| English Language Arts | 100.0 |
CERTIFIED PERSONNEL:
The following data was obtained via the KSDE website, School Finance Publications "Selected School Stats by District" reports and indicates the number of fully certified personnel in each category.
| K‐12 Teachers |
Special Ed Teachers |
Special Ed Director |
Reading Teachers |
Curriculum Specialists |
Library Specialists |
|---|---|---|---|---|---|
30.7 |
0 |
0 |
0 |
0 |
0 |
NON-CERTIFIED PERSONNEL:
| Regular Ed Aides |
Technology Others |
Technology Director |
Library Aides |
|---|---|---|---|
0 |
0 |
1 |
1 |
STUDENT / TEACHER RATIO:
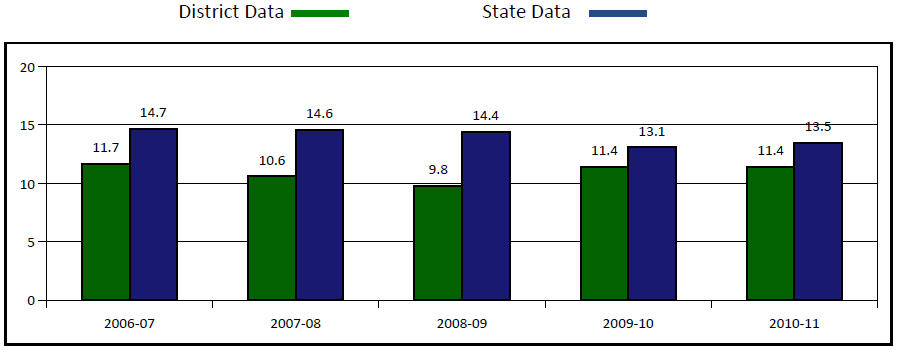
Comparison to Other Districts in the Area:
The following districts were chosen for comparison based on a combination of approximate student enrollment and / or their relative proximity to your district.
| COMPARISON DISTRICTS |
District County | 2010‐11 Enrollment |
Free Reduced Lunch |
Student / Teacher Ratio |
Assessed Valuation pr/Pupil |
|---|---|---|---|---|---|
| USD 111 Doniphan West Schools |
Doniphan | 365 |
41.1 |
8.2 |
140,240 |
| USD 335 North Jackson |
Jackson | 412 |
42.0 |
12.8 |
38,195 |
| USD 429 Troy Public Schools |
Doniphan | 367 |
43.1 |
11.4 |
53,291 |
| USD 430 South Brown County |
Brown | 603 |
70.0 |
11.4 |
36,646 |